The Birthday Problem
28 Oct 2015I’ve been working through Harvard’s Statistics 101:Introduction to Probability course recently. I’m really enjoying it, and a large part of that is down to the lecturer in the videos, Joe Blitzstein. He has a really great manner; he strikes a really nice balance between including a lot of technical detail but also tries hard to make the concepts intuitive, rather than simply making you memorise a bunch of equations. He also has a really deadpan sense of humour, which I appreciate when it crops up. You’ll notice if you watch the videos that he’s left-handed. Wikipedia says that “a slightly larger number of left-handers than right-handers are especially gifted in music and math”, because their brains are wired differently from righties. I wonder if there are a disproportionate number of left-handed professors compared to the general population? Anyway, I digress…
I’m currently on lecture 5, and so far we’ve covered counting and combinatronics, and conditional probability. Recently a friend and I got talking about the Birthday Problem, a very famous problem in probability theory. Although this was covered in the course, I couldn’t remember the intuitive reasoning for the answer. I thought I’d try and explain it here.
The Birthday Problem
The Birthday Problem asks:
How many people do we need at a party before there is a 50/50 chance that two of them share a birthday?
The Birthday Problem (also known as the Birthday Paradox) is an example of probability problem where the answer contradicts our intuitions. At first glance it seems like you would need loads of people before before there is a 50% chance that two will share the same birthday. 150 maybe? 200? The actual answer is 23 (that is, assuming that all birthdays are equally likely, and excluding people born on Feb 29, a day which only happens once every 4 years). It seems like such a small number!
A solution using maths
How did we arrive at the answer 23?
First, let’s think about how many people we’d need to be absolutely certain that two people have the same birthday. Using the pigeonhole principle, imagine that we have 365 pigeon boxes in an aviary, each of which is labelled with a date. So box one is labelled, ‘Jan 1’, box two is labelled ‘Jan 2’, and so on. Now, if we have a large pigeon collection, with over 366+ birds, we know that at least two pigeons are going to have to share a box. By the same token, if we have over 365 people at a party, by default two will share the same birthday.

Using mathematical notation, if \(k\) represents how many people are at the party, when \(k > 365\) then the probability of having a dual birthday is 1 (i.e. it’s absolutely guaranteed to happen).
At the opposite extreme, if we have only one pigeon, it’s absolutely impossible that it’s going to share a box with another pigeon. There just aren’t enough pigeons! :( So this time if \(k = 1\) (there’s only one person at the party) then the probability of a shared birthday is 0.

So we know that our probabilities will range from 0 (when \(k = 1\)) to 1 (when \(k >= 365\)). What if the number of people at our party is between 2 and 365? How do we calculate the probability that there will be a shared birthday with an intermediate number of people? In this case, it’s easier to first work out what is the probability that noone will share a birthday, and then simply take this value away from one to find the probability that at least two people will share a birthday (this rule is one of the axioms of probability).
In order to work this out, we’ll use what Joe calls the naive definition of probability. Very simply, this is just the version of probability most people are familiar with from school:
In this case, \(A\) is the event that noone will share a birthday at the party. I’ll break this down into two parts; the numerator and the denominator.
The denominator: number of total possible outcomes
For \(k\) people, the total number of possible combinations of birthdays that we could have is just \(365^k\), because we have \(365\)possible days for each person, and each person’s birthday is independent of every other’s, so we just use the multiplication rule to calculate the number of possible permutations. For example, if there are four people at the party, there will be:
…possibilities. This forms the denominator in our equation.
The numerator: number of outcomes possible for A
To work out how many possible outcomes there are where the \(k\) people don’t share a birthday, let’s imagine our four people are labelled from \(1 - 4\). Person \(1\) enters the room, and they can have any birthday they like, because they are the first one there. So person \(1\) has \(365\) possible birthdays. Person \(2\) arrives, and they are allowed to have any birthday except the one that person 1 has. So person \(2\) has \(364\) possible birthdays. Person \(3\) can then have any birthday except those of the previous two people, so they can have \(363\) possible birthdays, and so on.
So if \(k = 4\), the numerator for our equation is:
If we generalise this to all values of \(k\), we get:
This is how many possible combinations of non-matching birthdays there are if there are \(k\) people at the party.
Putting it all together
If we put our numerator and our denominator together, the general rule for finding the probability that no people in a party of \(k\) people will share the same birthday is:
So, using the axiom of probability I mentioned above, the probability that within a group of \(k\) people at least 2 people will share the same birthday is:
Which, if we plug in \(k = 23\) returns just over 0.5.
Thinking about intuition
Ok, ok, so maybe that explanation still doesn’t feel all that intuitive yet. Try thinking about it like this: consider the number of pairs of people as the party size increases. For any group of people of size \(k\), there are \(\binom{k}{2}\) possible pairs (using the binomial coefficient). So if there are 2 people at the party there is only \(\binom{2}{2} = 1\) possible pairing, with 10 people there are \(\binom{10}{2} = 45\) possible pairings, and with 23 people there are \(\binom{23}{2} = 253\) possible pairings. So, at a party of 23 people, there are 253 opportunities for two people to share a birthday. Now that 50% likelihood probability doesn’t seem so unintuitive after all.
Another way to think about it is that when many people hear the birthday problem for the first time, they interpret it as ‘what is the probability that I will share a birthday with someone at the party?’. That is a different problem than the one that was asked, and the likelihood of that is of course much lower. But it’s not all about you! There’s also all the possible pairs involving the other people at the party, each of which could result in a shared birthday. Their special days are also important :D
The Birthday Problem in Python
I thought I’d plot a probability distribution for this in Python.
1
2
3
4
5
6
7
8
9
#import libraries
from __future__ import division
import pandas as pd
import numpy as np
import matplotlib.pyplot as plt
import seaborn as sns
import datetime
import random
%matplotlib inline
I make an empty pandas dataframe with columns named ‘k’ and ‘probability’, where ‘k’ equals numbers in the range 1 to 365.
1
2
birthdays = pd.DataFrame(np.empty([365,2]), columns = ['k','probability'], index = range(1,366))
birthdays['k'] = birthdays.index
Then I make a function that will calculate the probability of a shared birthday for a given group of \(k\) people:
1
2
3
4
5
6
7
def probability_of_shared_bday(k):
    end_point = 366 - k
    ratio = 1
    for i in range(end_point, 366):
        ratio *= i / 365
    probability_of_no_match = (1 - ratio)
    return probability_of_no_match
I then apply this across the dataframe and plot it:
1
2
3
4
5
birthdays['probability'] = birthdays['k'].apply(probability_of_shared_bday)
birthdays.plot(x= 'k',y = 'probability')
plt.xlim(0,100)
plt.xlabel("Number of people at the party")
plt.ylabel("Probability of a shared birthday")
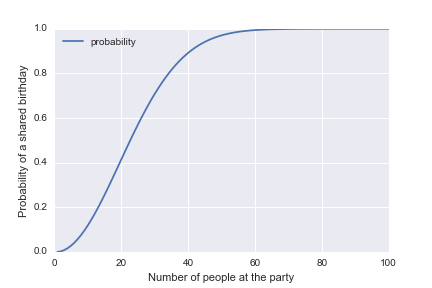
What you’ll notice on the resulting graph is that the greatest increase in probability happens between 0 and 50 people. After 50 people, we’ve essentially reached near certainty that there will be a shared birthday.

Does the Birthday Problem hold up in reality?
It’s all well and good accepting this proof, but it’s also fun to test this out with SCIENCE.
I exported all 340 of my facebook friend’s birthdays to .ics format, and then loaded this into pandas. Some munging was needed but it’s not very interesting; if you care about it you can see the ipython notebook here.
I plotted out the frequency of birthdays per day on a histogram:

The dates are in the format mm/dd along the x axis. There seems to me to be a pretty even distribution of birthdays throughout the year. August 8 is a particularly birthday-rich day amongst my facebook friends. Note that days with no birthdays are not shown.
Now let’s do some bootstrapping to generate fake parties with randomised groups of my facebook friends (can you imagine organising parties like this in real life? It would probably be really awkward).
Here’s a function that repeatedly resamples a group of \(k\) people from my facebook friends 1000x (with replacement after each party), and figures out whether or not there are any shared birthdays within each group. It then calculates the proportion of the 1000 terribly awkward parties that contained participants with shared birthdays:
1
2
3
4
5
6
7
8
9
def proportion_shared_bdays(k):
    parties_with_shared_bday = 0
    for i in range(1000):
        random_indexes = random.sample(range(1,341),k)
        party = fb_birthdays_df['datetime'][random_indexes]
        if sum(party.duplicated())>0:
            parties_with_shared_bday +=1
    proportion_shared_bdays = parties_with_shared_bday/1000
    return proportion_shared_bdays
So if I test out this function with 23 people (remember, in theory a group of 23 people should theoretically contain a shared birthday 50% of the time)…
1
proportion_shared_bdays(23)
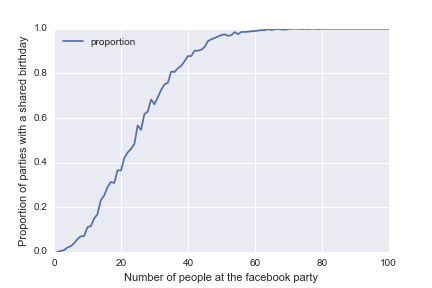
…this returns a value around the 0.47 mark. That’s pretty close to what we’d expect, despite not controlling for things like seasonal variation (more people born at certain times of year), the prevalence of twin/triplets (I know at least two pairs of twins on facebook) and the relatively small sample size (only 340 people to sample from :’C).
Let’s see what this looks like plotted out:
1
2
3
4
5
6
7
8
fb_probabilities = pd.DataFrame(np.empty([340,2]), columns = ['k','probability'], index = range(1,341))
fb_probabilities['k'] = fb_probabilities.index
fb_probabilities['probability'] = fb_probabilities['k'].apply(lambda x:proportion_shared_bdays(x))
fb_probabilities.plot(x= 'k',y = 'probability')
plt.xlim(0,100)
plt.xlabel("Number of people at the facebook party")
plt.ylabel("Probability of a shared birthday")
plt.savefig("fb_probabilities")

You can see that there’s the same general shape as before. Aren’t you glad that we didn’t have to have thousands of actual parties to figure that out? Programming FTW!
My ipython notebook for these analyses is available here. If you’re taking this course, I can recommend William Chen’s great cheat sheet. Thanks for reading!